Why separate dashboards mislead you
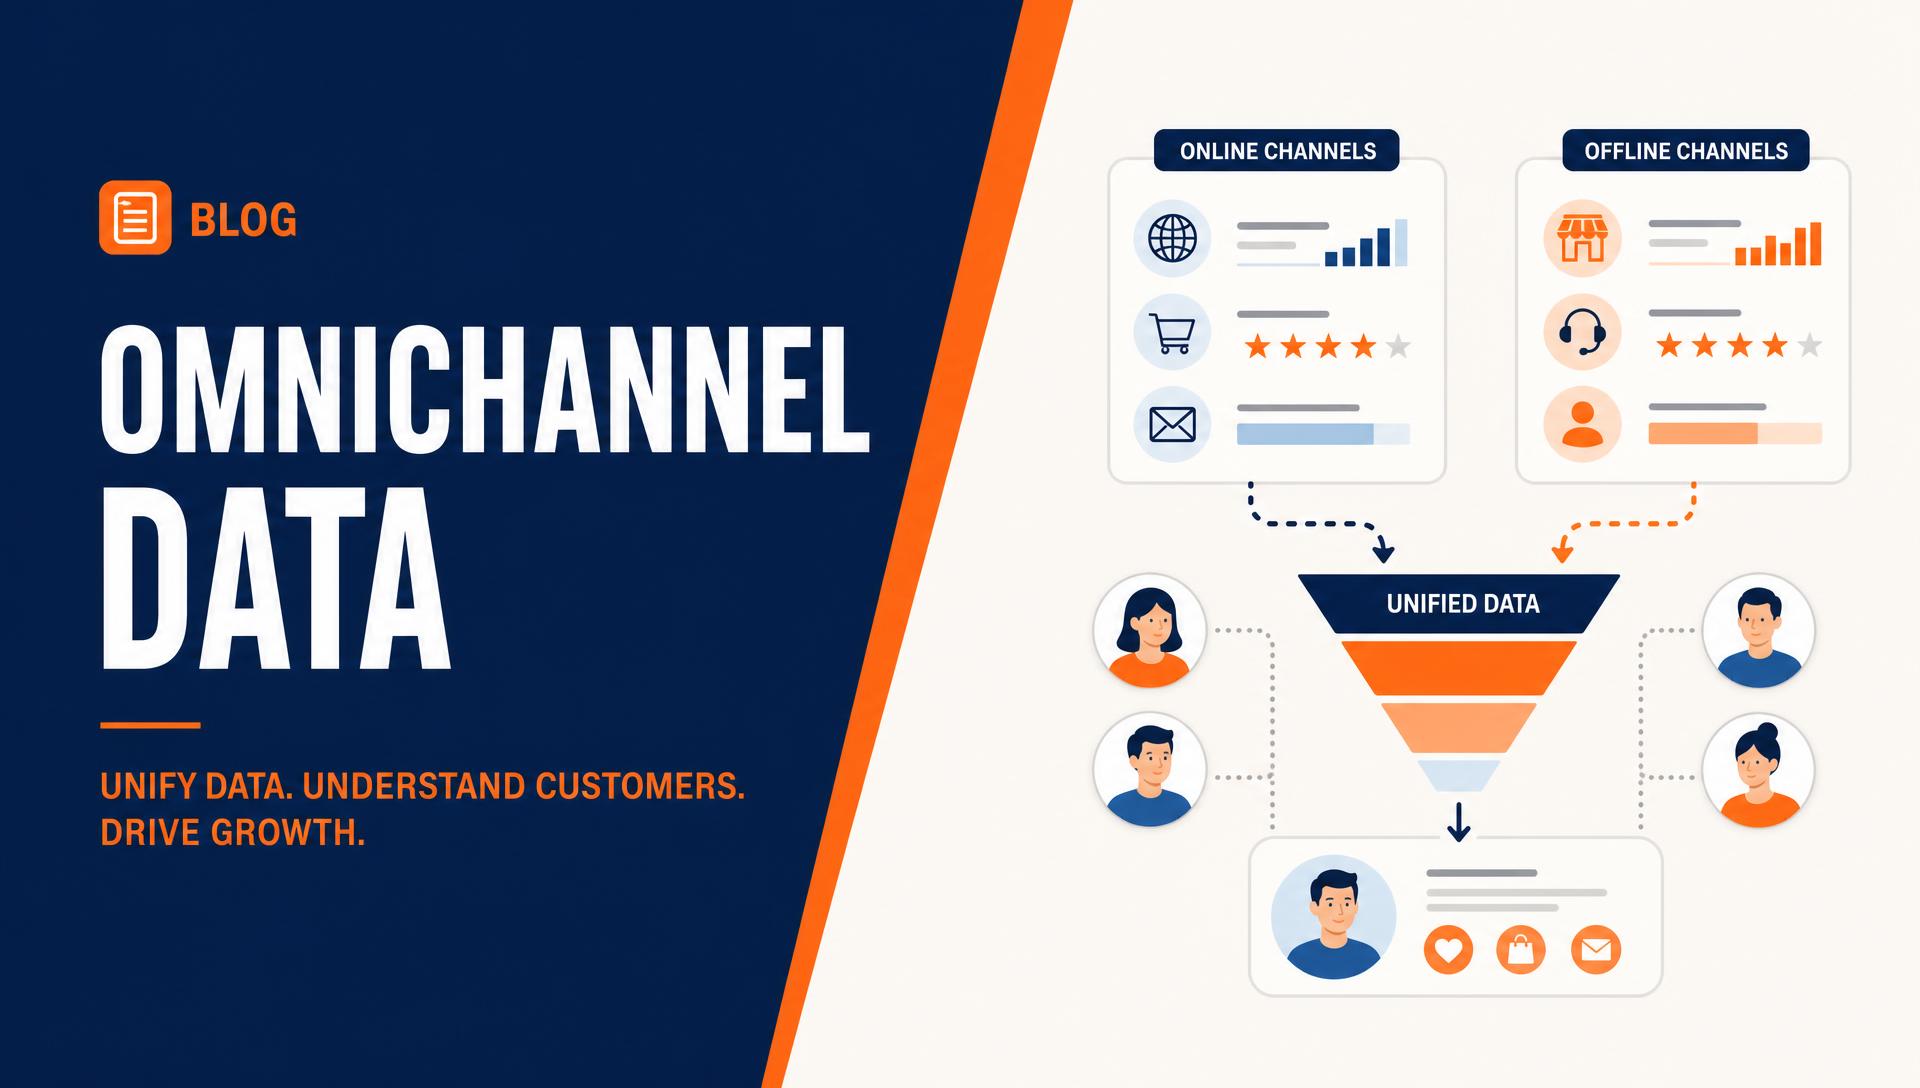
When Amazon and DTC are reported in isolation, every shared cost gets misattributed. A social campaign that drives Amazon searches shows as wasted DTC spend, and Amazon looks artificially efficient because it inherits demand other channels created.
The fix is a single blended view: total contribution profit divided by total marketing spend, with channel detail underneath rather than at the top.
- Blended contribution margin: revenue across both channels minus product, fulfilment, fees, and media
- Blended acquisition cost: total media spend divided by total new customers across channels
- Channel mix trend: what share of new customers each channel produced this month
The metrics that actually matter
| Metric | Where it lives | What it tells you |
|---|---|---|
| Unit session percentage | Amazon Business Reports | Listing conversion health |
| Search Query Performance | Brand Analytics | Share of impressions, clicks, and purchases per query |
| Amazon Attribution | Advertising console | Which external traffic converts on Amazon |
| New-to-brand orders | Advertising console | Whether ads are acquiring or just harvesting |
| Repeat rate 90 days | DTC platform | Whether DTC retention justifies its acquisition cost |
| Blended contribution margin | Your own model | Whether the whole business is actually profitable |
Setting up Amazon Attribution properly
- Create a tag for every off-Amazon source: Meta, Google, TikTok, email, influencer, and blog content
- Use one tag per campaign, not per channel, so you can compare creative rather than platforms only
- Track new-to-brand rate on tagged traffic to see which sources bring genuinely new customers
- Review monthly against DTC results from the same campaigns before shifting budget
Measuring the halo effect between channels
The halo effect is real but easy to overstate. The practical test is a geo or time holdout: pause a DTC channel for two weeks and watch branded search volume and Amazon branded-term orders. If both dip, that channel was feeding Amazon.
Run the test in the other direction too. Increasing Amazon ad spend usually lifts branded search on Google, which shows up as cheaper DTC traffic a few weeks later.
A reporting cadence that survives contact with reality
- Weekly: ad spend, ACOS, unit session percentage, and DTC conversion rate
- Monthly: blended contribution margin, blended acquisition cost, new-to-brand share
- Quarterly: channel mix, lifetime value by first-purchase channel, holdout test results